
In a prior blog post I described how I was looking into DynamoDB for storing time based data, which did not work as expected. This work was part of a larger effort to investigate 'micro-services' such as AWS Lambda. Such services allow applications to be built up from small parts, each of which designed for specific aspect of the application, with a defined interface (many times using JSON). This allows application programmers to change underlying part of the technology without changing the application as a whole.

E.g. in the case of DynamoDB for time-based data, if I had built an application that used DynamoDB, exposing a REST based interface that a application could use, I could switch out the DynamoDB based implementation for one implemented using S3 and the application's functionality would not change. Clearly this is helpful in the current world of highly connected devices and resources and application that combine many sources of information into a mash-up.
Another advantage of micro-services is that one no longer needs to worry about building underlying infrastructure such as databases servers, web servers, etc. Of course you still need to be confident in and have the contractual framework in place with the service provider, since you defer the responsibility of running and maintaining the infrastructure to that vendor and it will be a critical part of the application.
Over the next few blog posts I will describe how I've converted a small aspect of a current web site to AWS based micro-services, what services I used and what some of the challenges were. The functionality I worked on was a graph that displays electricity usage on campus, part of the FRES web site. The reason I chose this was for two reasons. 1 - ISC is currently in the process of helping our clients move Drupal and WordPress based web sites of the current 'origin' Penn web-server. ISC is currently providing a Platform as a Service for these technologies, hosted at Pantheon. Since the functionality for the graphs uses a set of technologies that are not supported at Pantheon, we needed to look for an alternate implementation. 2 - I was also looking to more cleanly separate the data and presentation which due to the usage of PHP was not a high priority for the original implementation.
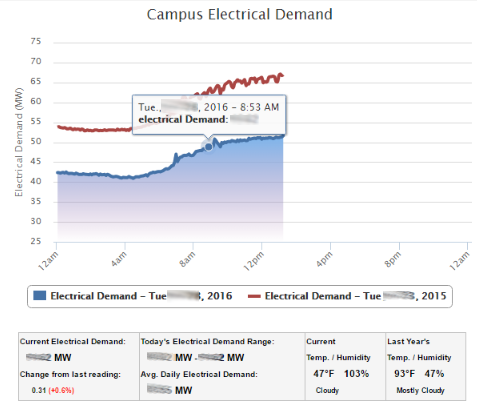
The functionality of the electricity display is relatively simple. Normally, it displays a graph of the electricity usage on campus and compares it with the usage the prior year, for the same weekday and the same day of the week. The data it uses is gathered from an FTP server that the facilities team maintains. This server updates a flat CSV file every 5 minutes, with the environmental data. That data is continuously collected and the graph is a reflection of the collected data.
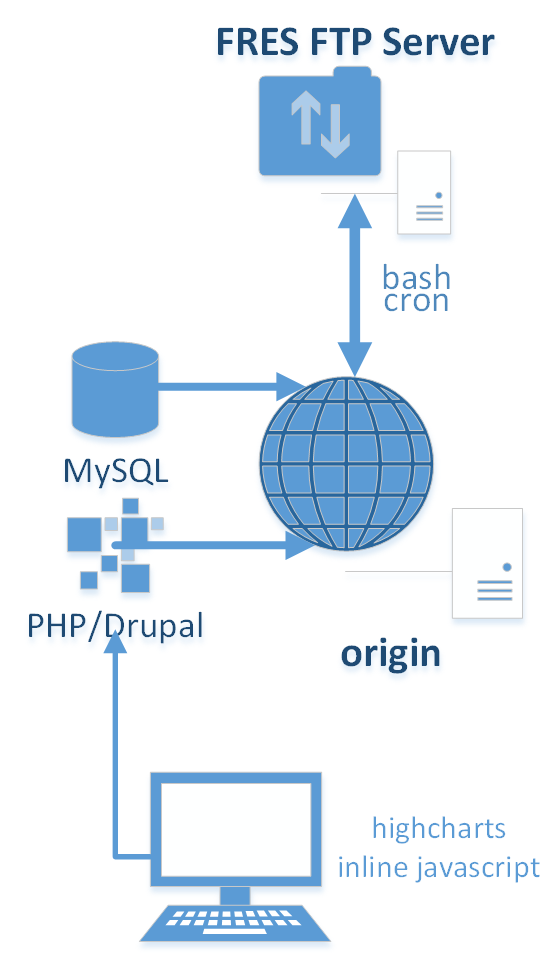
On the left is a diagram of the original implementation. All of the code is running on the origin web-server in a variety of places. The solution uses a perl script, running out of cron, to fetch the environmental data (including electricity use) from the FRES FTP server. That continuously collected data is stored in a MySQL database running on the origin server. That database is in the same database schema that is used for Drupal, though that goes against standard Drupal practices. On the web client side, the chart is displayed on a page which uses an iframe, which gets the composed HTML from a PHP script running on the web server. The data that is displayed on the graph in the iframe is composed on the fly from the MySQL database and is part of the HTML page that is returned to the web client.
In future blog posts, I will describe how I used Lamda and Events to replicate the functionality currently provided by the perl script and cron. I'll also describe how I used S3 instead of MySQL to store the data and how we get that data back for the display in an efficient manner.
Stay tuned!
If you have any comments, questions or other observations, please contact me directly via email: vmic@isc.upenn.edu.